With the support of six Ontario dry bean producers located in Huron, Perth and Oxford Counties, a large seeding rate trial was conducted over 3 years on approximately 900 acres of cranberry beans, 600 acres of white beans and 200 acres of black beans. The objectives of the project were to:
- Demonstrate the use of a new yield monitor for coloured bean combines, and
- Evaluate the opportunity to adjust seeding rates to reduce economic risk
QUICK SUMMARY:
- average optimal (economic) blanket seeding rates for white/blanks beans 88,000-94,000 seeds/ac
- average optimal (economic) seeding rate for cranberry beans was 54,200 seeds/ac
- assuming you know the optimal seeding rate for each yield zone in a field, variable rate seeding by yield zone improved white/black bean returns by $7/ac on average and cranberry bean returns by $18/ac on average
- very little was learned about what soil parameters could be used to drive variable rate seeding decisions
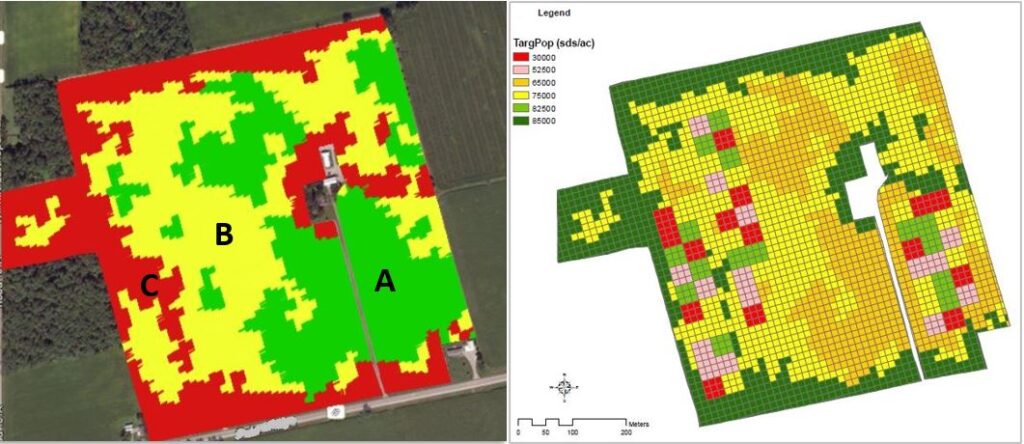
Using Premier Equipment’s Enhanced Learning Blocks, and significant support from Greg Kitching, four different seeding rates were planted in randomized, replicated plots (Table 1). Each seeding rate was replicated 15 times per field, and each plot was approximately half an acre in size. Before building the seeding rate prescriptions, each field was divided into 3 different yield zones (high yielding (A), average yielding (B), below average yielding (C)) based on historical yield and input from the producer, and the replicated plots were divided across the three yield zones (Figure 1).
Table 1. Target seeding rates used for white and cranberry beans.
| White/Black Beans
Seeds/ac |
Cranberry Beans
Seeds/ac |
| 44,000 | 40,000 |
| 77,000 | 52,500 |
| 110,000 | 68,000 |
| 120,000 | 82,500 |
Plots were seeded by the producers using their variable rate planters and yield data was collected from their combines. New load cell yield monitors, designed by Greentronics in Elmira, were installed on the Pickett Twin Master combines of the two cranberry bean cooperators (more info HERE). With just a few exceptions, all crop inputs other than seed were blanket applied to the project fields. SoilOptix was used to measure over 20 different soil parameters on each field, and plant populations were counted by hand on a subset of plots. All fields were planted on 30” rows (two fields were twin rows on 30” centers) and producers grew the varieties that best suited their farms. The varieties included white beans varieties Nautica, Mist, Apex, T9905, black variety Zorro and cranberry variety Etna. The original intention was to collect data on 900 acres of white beans but one cooperator switched to black beans which was determined to be an acceptable comparison. Also, a planter error ruled out one field of white beans. Statistical analysis of the dry bean data was conducted by Ken Janovicek, University of Guelph. As-applied seeding rate data collected from planters was used in the analyses rather than the target seeding rate, as there were sometimes large deviations from target rate.
Results: Emergence
Emergence percentages for black and white beans were often the lowest when seeded at the smallest treatment seeding rates. Over all locations and zones, emergence percentages averaged 74, 81, 82, and 84% for the target seeding rates of 44,000, 77,000, 110,000 and 120,000 seeds/ac, respectively. For cranberry beans, emergence percentage among the various zones and locations was usually between 65-90%. Emergence percentage response to cranberry bean seeding rate among the various locations and zones ranged from nil to 16% higher as seeding rates increased from 40,000 to 80,000 seeds/ac.
Results: Optimal Seeding Rate Correlation with Soil Parameters
The SoilOptix® sensor (soiloptix.com) is mounted on an ATV and driven across the field in 12-15 meter wide swaths. The sensor measures gamma radiation, a form of penetrating radiation emitted through the natural decay of radiation sources. Approximately 10 reference soil samples were also taken in each field to a depth of 15-20 cm to calibrate sensor readings. The SoilOptix data includes measurements of the following data layers: elevation, clay content, loam content, sand content, silt content, soil organic matter, pH, boron, calcium, magnesium, calcium:magnesium, cation exchange capacity, iron, potassium, potassium:magnesium, manganese, phosphorous, sulphur, zinc, leakability and plant available water. Leakability and plant available water are unitless index layers comprised of the soil texture component and organic matter.
For the various physical parameters measured, only elevation was correlated with optimum seeding rate across all white/black bean locations. Although the data suggests that optimal seeding rates increase at a rate of 150 seeds/ac per foot increase of elevation, it is not clear if this relationship is real or the result of other unknown factors. Elevation did not correlate with optimum seeding rate within a given field, suggesting that perhaps the optimal seeding rate correlation with elevation is due to other unknown factors. Within field analyses indicated there was a weak relationship between optimal seeding rate and plant available water. It makes agronomic sense that more available water may have a higher optimal seeding rate since each plant needs a certain amount of water for successful growth.
Optimal cranberry seeding rates were not correlated with any of the soil physical parameters measured. This means that it was not possible to identify a physical measurement that could be used to develop a cranberry seeding rate prescription. Overall very little was learned on this project about what soil parameters producers should use to guide variable rate seeding decisions.
Results: Seeding by Yield Zone
Zones were identified as A, B or C based on their anticipated expected yield potential with A expected to have the largest yield and C the smallest. At some locations only 2 zones were identified because it was felt the fields had low yield variability. Of the 8 white/black bean fields in the study, 3 resulted in yields that did not differ significantly across all zones. At the remaining 5 trials, only at 2 locations did zone A have distinctly larger yields and at 1 location zone C actually produced the largest yield. This demonstrates that actual attained bean yields often did not match the anticipated yield variation of the zones. This suggests that it may be difficult to accurately conduct variable rate seeding by yield zone if we cannot accurately anticipate the yield variation across the field.
Optimal seeding rate across zones within a field varied from no difference across zones to a difference of 75,600 seeds/ac. Figure 2 illustrates the profit response to seeding rate for each zone at one black bean location. At this location zone B yields did not increase with increasing seeding rates and as a consequence profit declined with increasing seed cost. The other 2 zones did have yield gains with increasing seeding rates up to optimums of 107,200 seeds/ac for zone A and 77,500 seeds/ac for zone C.
The green portions of these curves represent the range of seeding rates that produce returns within $10/ac of the maximum estimated return for each zone. The profit response to seeding rate illustrated in Figure 2 is typical of most white/black bean locations. Aside from fields that had their highest profit at the lowest seeding rate, most fields had a relatively wide range of seeding rates that produced returns within $10/ac of maximum.
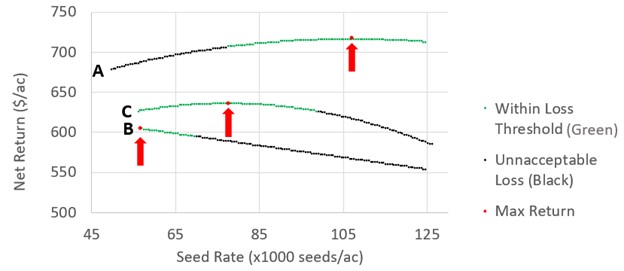
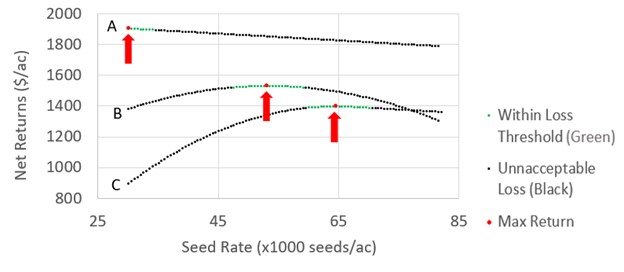
Figure 3 illustrates the profit response to seeding rate for each zone at one cranberry bean location, which was one of the locations with larger variation in zone optimal seeding rates. Regarding these two figures, a few things can be noted:
- For white/black beans the green areas of threw curves (seeding rates within $10 of maximum returns) are generally wider than for cranberry beans, which may reflect both the higher price of cranberry beans and the potentially higher flexibility of white beans in adapting to different populations
- There is more overlap in the green areas of the curve for each zone in the white/black bean example, which may indicate that for white/black beans it is easier to find one blanket seeding rate that maximizes or nearly maximizes financial return
- It has been generally thought that seeding rates can be reduced in higher yielding areas to maximize returns, but the Figure 1 shows that is not always the case.
Results: Blanket Seeding Rates vs. Variable Rate Seeding
For both white/black beans, yield does not correlate with seeding rate. This means that a given seeding rate will produce different yields on different fields.
For white/black beans the range of seeding rates that produced returns within $10/ac of the maximum was often relatively large, averaging 50,000 seeds/ac. At 7 of 8 locations seeding rates of 88,000 – 94,000 produced net returns that were within $10/ac of the maximum estimated net returns. This is somewhat lower than the OMAFRA recommended seeding rate for white beans on 30” rows.
Over all 8 white/black bean locations, net returns at the field optimal seeding rate averaged $599/ac with an average profit gain of $36/ac over returns obtained at the smallest seeding rate. If the various zones (A, B, C) each represent 1/3 of the field, net returns associated with seeding each zone at its optimal seeding rate (i.e. variabelr ate seeding by yield zone) averaged $606/ac. This is only $7/ac more than returns produced using a blanket optimal seeding rates. At only 1 of 8 locations did variable seeding increase returns by more than $20/ac.
Averaged over all 11 locations, the field optimal seeding rate for cranberry beans was 54,200 seeds/ac. This is lower than the OMAFRA recommended seeding rate for cranberry beans on 30” rows. Note that maturity may take longer where populations are lower and plant branching increases. This should be taken into consideration for producers in regions north of where the project was conducted in Oxford county.
For the 9 cranberry bean locations with multiple zones, net returns at the field optimal seeding rate averaged $1381/ac. Net returns associated with zone specific variable seeding averaged $18/ac over the returns produced using a blanket optimal seeding rates.
The primary conclusions of these trials are that 1) we have not gained a good understanding of what soil parameters should drive variable rate seeding decisions, 2) variable rate seeding by yield zone rarely produces large net return gains and 2) perhaps identifying the optimal blanket seeding rate for a given field could increase net returns provided that the factors causing differences in field specific seeding rates are understood.
This project was funded in part through the Canadian Agricultural Partnership (the Partnership), a federal-provincial-territorial initiative. The Agricultural Adaptation Council assists in the delivery of the Partnership in Ontario.